
I recently read a job posting for a technical writer where creating swimlane flow charts is a job requirement. I have created flow charts in the past, but this had me thinking what is a swimlane flow chart and what makes it different from other flow charts. I quick search engine query gave me the definition of swimlane flow charts.
Much of communicating and writing is knowing the right tool to use at the right time. Lets take a look at the types of flow charts and when they should be used.
What are Flow Charts
A flow chart is a diagram that represents a process, workflow, or data flow. In the diagram, steps are shown as boxes with arrows connecting them. The arrows indicate the flow of the information or data. Typically process or activity steps are denoted as rectangle boxes. Decisions re denoted as a diamond. This is a very simple explanation of what a flow chart is and its common symbols. There is more than one type of flow chart. Each has its own purpose depending on the industry or situation needing charted. The power of the chart is using the correct type to display the content. Together these bring meaning to the diagram.
Types of flow charts and their uses
- Process Map/Process Chart: This type of flow chart is used to map a process. These can be used to troubleshoot problems or provide walkthroughs for decisions. One example of a process map would be to fill an order. Each step in the process leads to its own string of possible decisions and actions.

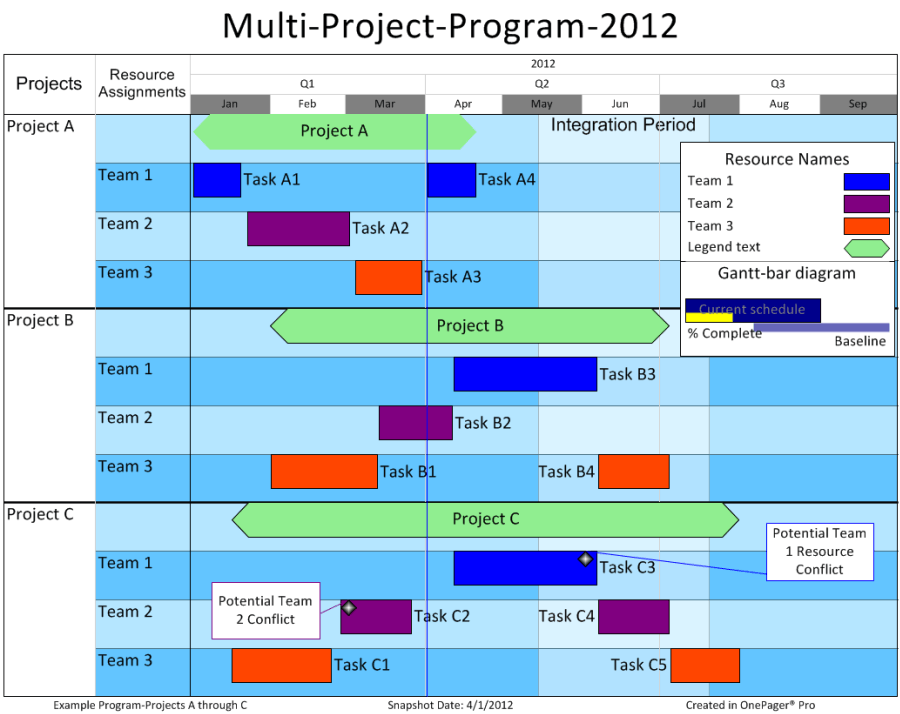
- Swimlane Flow Chart: Swimlanes shows distinct but linked processes in a process. The swimlanes, much like those in a pool, divide actions and decisions into separate lanes. The lanes can represent who is responsible for the process. This could be employee roles or the uses for a piece such as internal vs. client facing.

- Workflow Diagram: Workflows are a visual representation of a process. Each step of the process is shown so simplifies complex processes. This allows viewers to focus on one step at a time. These can also include the length of time each step should take. A nursing agency may make such a diagram for their staff to follow while admitting new patients or human resources could make a diagram for the request and approval of employee vacation time.

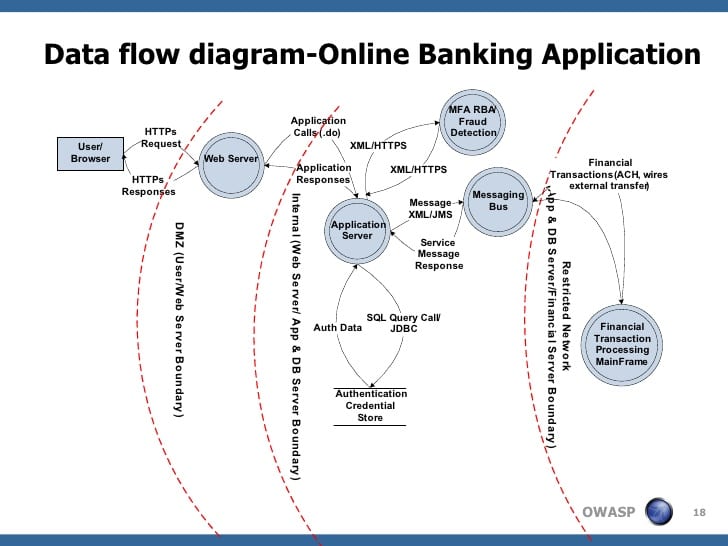
- Data Flow Diagram: Data flows show how data moves through an information system. They are used most often in system design and analysis.


Resources:
https://en.wikipedia.org/wiki/Flowchart