Initial results from Camilla’s Tree Inventory
The tree inventory Camilla completed focuses on South Homewood, a neighborhood within Homewood, that has a total area of 0.398 square miles and a population of 2,344 residents. As of 2014, South Homewood’s tree canopy cover was in the range of 5 to 20 percent, where a Pittsburgh’s city-wide average is 42 percent. Based on the low tree density of the neighborhood, Camilla’s tree inventory is comprised of three stages:
1) Mapping
2) Field survey and inventory
3) Descriptive and multivariate statistics as well as Geographic Information System (GIS) to analyze the tree canopy data.
As for parameters, the tree inventory focused on trees located on sidewalks and were very clearly street trees and those located on public property (i.e. schools, churches, stores, etc.). In accordance with these parameters, Camilla’s tree inventory focused on collecting data on the number of trees, whether initial living or dead, any observational clues indicating health, and other measurements to calculate biomass and carbon sequestration.
Findings:
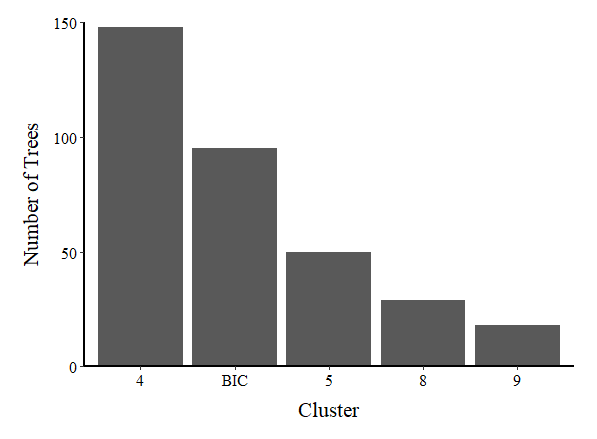
- Graph 1: Cluster 4 has the highest number of trees (150 estimation) whereas Cluster 9 has the lowest number of trees (estimation 20-25)
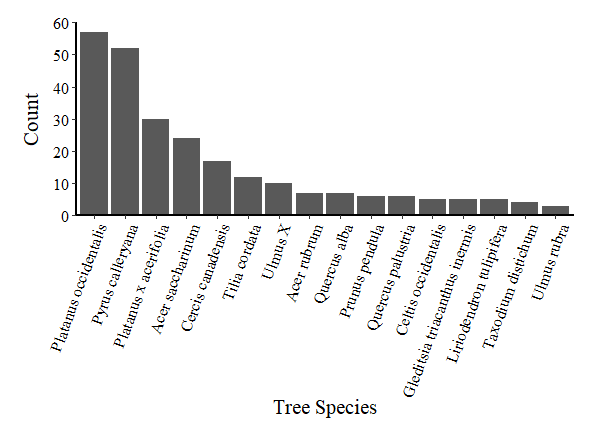
- Graph 2: Sycamores (57), Bradford Pears (52), London Planetree (30), Silver Maple (tbd) (24), and Eastern redbuds (17) are the top five species in South Homewood

- Graph 3: Even though it has the second highest tree density, the Business Institutional Core (BIC) is the more species diverse (based on genus) cluster in comparison to the other four.
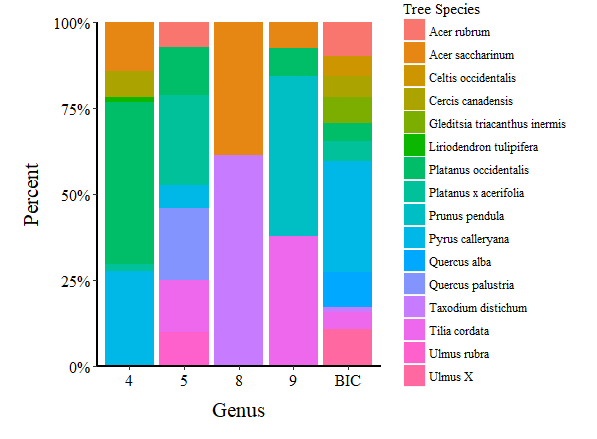
- Graph 4: Shows the species diversity in terms of tree species across the five clusters
Leave a Reply