Product
My work for this Digital Humanities Project consisted of gathering all the words used in Chapter 2, Book 3 of “The Generall Historie of Virginia, New-England, and the Summer Isles by John Smith (1624)”. After doing so I would count the words and pick the ones that were used the most and decide if they are positive, negative, neutral or both. Then I would decide if the term was general or specific to the text.
For this project I would be using multiple tools. I started off with voyant-tools.org, where the program would count all the words for me and put them in a chart with different colors and sizes. This helps me because of my dyslexia, if it were all one color, I would probably get lost. After gathering the words and choosing the top twenty-four I read through the text and decided if the word was positive, negative, neutral or both. I found that Twelve of the words were neutral and this was because some of the words were a description, for example, town, brought or came. Nine of the words were positive, one word was negative, and two words were used as both positive and negative. I took those same words and decided if they were used in a specific manner or more of a generic form. My findings were that fourteen of the words were used generically and 10 of the words were used as a specific term.
After finding all this out I then went to Microsoft Excel, where I started tables for each of my categories. After setting up all my tables and plugging everything into where they went, I went to a program called Tableau.

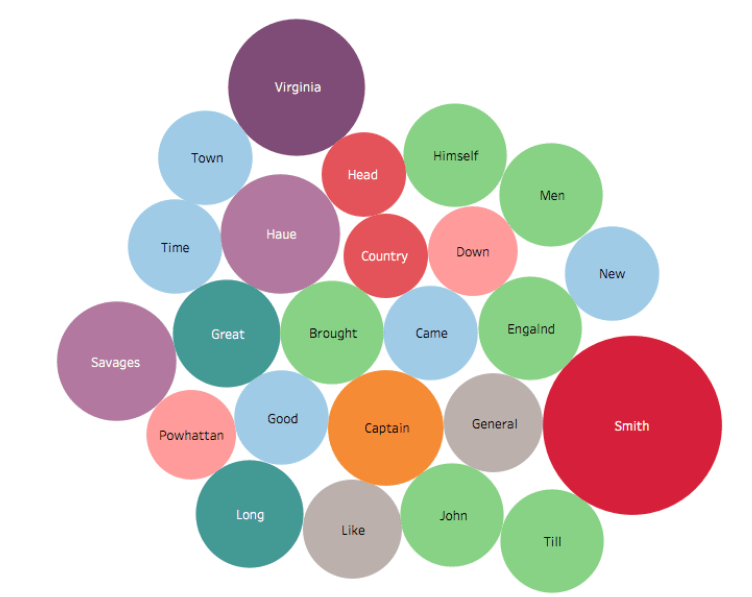
This program allows you to take your information and make visual graphs. I made a total of four graphs for this project. The first one is a bubble graph, I used this because, for someone like me, this is a good way to represent the differences in the words. The more words used, the bigger the bubble. I also took the words that were used the same amount of times and made them the same color so that when you look at the words “town” and “time” you see that they are not only the same size, but the same color. That indicated those word were used the same amount of times.
My second graph was a horizontal bar graph with two categories. Category one was generic and the second was specific. The words also have if they are positive or negative beside them. 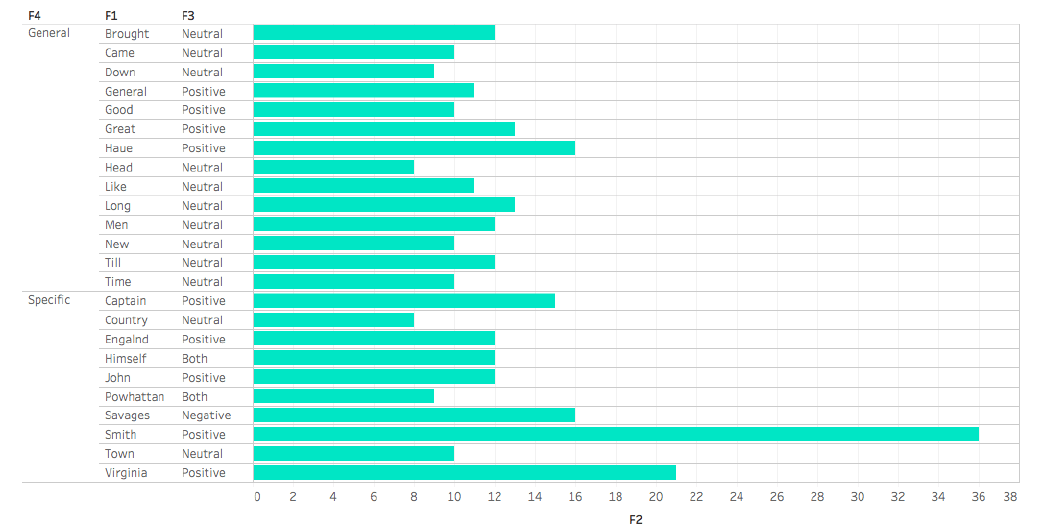
Graph three was a pie graph that shows how many words were positive, negative, neutral or both and all the sections are different colors.

My fourth and last graph was another pie chart, this time showing general and specific words used.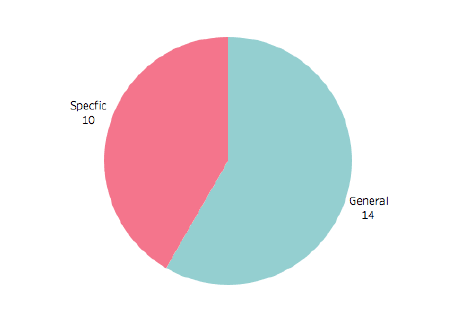
I decided to do all these graphs because I wanted to keep in mind that people all see things differently and some prefer some graphs over others. I took the three most popular graphs and used those in hopes that someone would find one that they like and understand my project. In my findings of this work I found that John Smith used 5,212 words and 1,497 unique words. The average word per sentence is 49.6 and the top words used are Smith, Virginia, Haue, Savages, and Captain. According to “Best Novel Project”, the projected word count for a chapter is 4,280 words, if this is the case, that would mean that John Smith was writing above average and has a high word count.
My conclusion on this work and from my project is that there were a lot of general and neutral words in this text about an adventure someone went on. It is a good read however, and I feel that because of the word count that John Smith was doing pretty well. I do think that this was a story more about himself rather than the adventure he had went on or hoped to find and that maybe he could have used more emotional words for people to understand his feelings more. My conclusion on the project itself was that it was a very enlightening and a fun experience. Understanding how some of the information we have is compiled and made and learning how to make it visually fun was very inspiring. Not all research has to be just papers, words and phrases that some people may not understand but that we could add in a fun element to it and make it so that the reader can see what it is we are trying to get across rather than reading it and trying to figure it out. It was also interesting to take a text written from long ago and analyze it to see how high their word count was.
Works Cited
Frazier, Christine, et al. “Words Counts of Bestselling Novels.” Better Novel Project, 6 July 2018, www.betternovelproject.com/blog/word-counts/.
Hanrahan, Pat, et al. “Tableau.” Tableau Changing the Way You Think about Data, Jan. 2003, www.tableau.com/.
Smith, John. “Chapter 2, Book 3 of ‘The Generall Historie of Virginia, New-England, and the Summer Isles by John Smith (1624).” Voyant Tools, 1624, voyanttools. org/?corpus=2af662112384f85cf2123ae96e02e82f.
Smith, John. “Transcription from Original.” Armistead, Lewis A. (1817–1863), 9 July
2014, www.encyclopediavirginia.org/Smith_Chapter_2_Book_3_of_The_Generall_Historie_of_Virginia_New-England_and_the_Summer_Isles_by_John_1624.
Process
The text that I had chosen was Chapter 2, Book 3 of “The Generall Historie of Virginia, New-England, and the Summer Isles by John Smith (1624)”. I picked this text because I enjoy traveling and travelers. Learning about their adventures and the hardships they may have endured but I also picked this text because it was interesting to me. Growing up all I ever known of John Smith was that he was a guy who traveled to a new world, fell in love with an Indian woman who was the grand chief’s daughter and saved all the Indians from being killed by their captain.
My hypothesis came in two parts. My original thinking was that John Smith would not have had a wide range of vocabulary and that the story would make be more positive or negative. I thought this because of my lack on knowledge and understanding of the John Smith story but also my lack of understanding of writers in that time. Not really having faith in those back then all because they may not have had the same learning we do today. I always thought and was told that a long time ago, all people did was learn to read and write if they needed to but spent almost all their time working. That they did not have time for reading and writing for fun. My ignorance is what lead me to this conclusion that was later proven to be wrong.
The tools I used in this project was voyant-tools.org, Microsoft Excel and Tableau. I used voyant-tools to count the words in the text so that I could use that information in Excel and then later figure out if the words were positive, negative, neutral or both positive and negative. I would also use the counted words to figure out if the words were general or specific terms. After making tables in Excel I would plug them into Tableau and make visual graphs. For the text itself I used the link provided in week two to have a digital copy of the text to plug into voyant-tools. After doing my whole project I would use Microsoft Word to make my blog posts and then add them to Moodle.
The steps I took in order to do this project was reading the text multiple times and then thinking about what it was I wanted to do. I thought about my first thought of the text which was the length and I went from there. I then made an appointment with Dr. Tippen to discuss and plan out my project more and get some resources I may need to complete my idea. Afterwards I reread the text and then took the link from the online version of the story and put it into voyant-tools. After getting all the information I then plugged everything into Excel and got all my pre-graphs ready. After that I made another appointment with Dr. Tippen so that I may get any further advice I may need to continue moving forward. We made a timeline for me so that I may stay organized and finish everything on time, then, Dr. Tippen gave me a tutorial on how to use Tableau, I then went and worked with the program. After getting all my final graphs done, I then double checked my work by reading the text one last time and then started on the blog posts.
The challenges I came across were learning how to use Tableau and then understanding the text. I had to reread it a few times to understand but after doing so it became easier and like any program I played around with Tableau and watched some YouTube videos on it to feel more comfortable with it. I feel doing so made me a stronger person and more confident in the work I will be presenting.
I feel really good about my project, I put a lot of work and hours into it and I feel that it truly represents what I found with the text. I feel it does meet the expectations of the assignment, but I will not truly know until I get my grade back on it and see if there was anywhere I may have been able to improve on.
If I had unlimited time and energy for this project, I think I would make it more interesting in a way. I am a very visual and art type of person. I feel I did not make this project as “pretty” as it could have been and what I may do differently would be to take more time into the art aspect of it and make a presentation that makes it more interesting to the viewer. Maybe add some photography in there, as I am a photographer. But that would also require me to travel so the unlimited time would help with that.
I feel there are many ways someone else could interpret the text I read and maybe make the project more their own. They may even make a project the counters mine, but they would also maybe think the same as me and make a more interesting and visually appealing project that captures the reader/viewers attention. If someone were to want to expand on my work, I would probably tell them to have at it. Seeing other people’s viewpoints is very inspiring and you can learn a lot from it. I may see something I may not have ever thought about and could use that in the future to enhance my work.